T-Metrics Market Sentiment
by T-Metrics
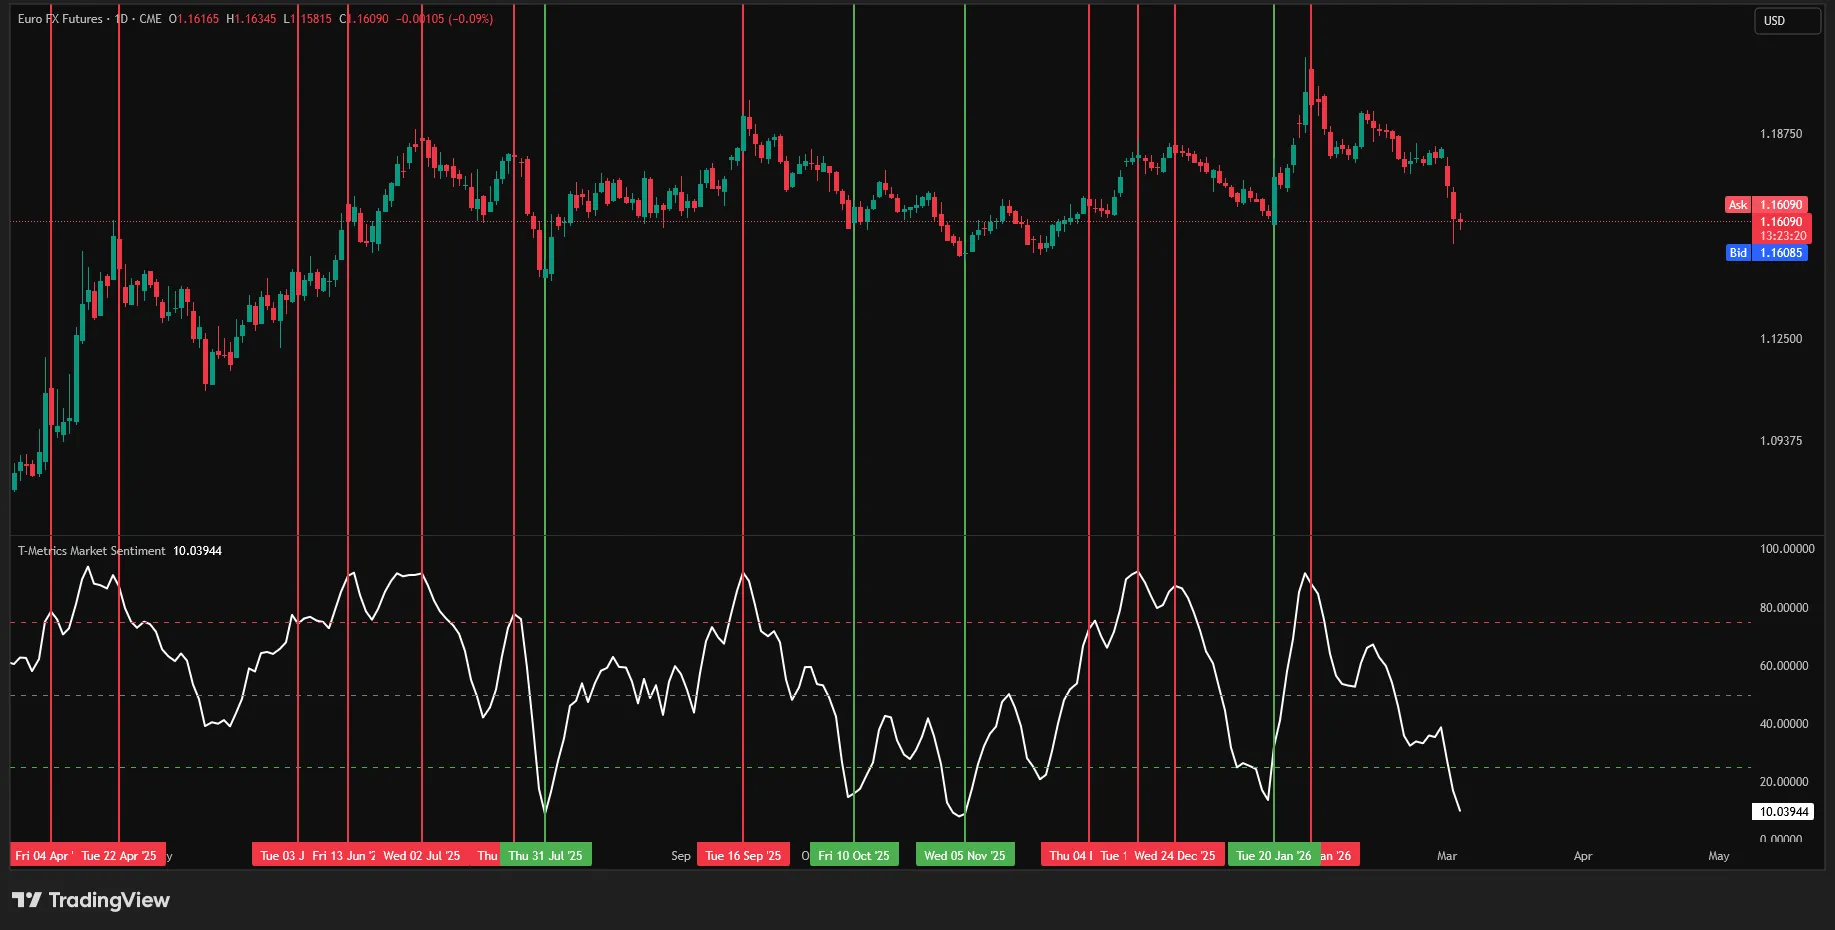
Markets don't move linearly — they overextend. This index measures the true psychological overextension of price and shows mathematically when a trend is exhausted. Use the rubber-band principle to trade reversals at peak probability.
Features
- High-effective Index Line
- Overvalued & Undervalued Levels
- Alert Function
Description
T-Metrics Market Sentiment aggregates 11 independent sub-indicators into a single normalized index on a 0-100 scale. The index measures how far price has deviated from its statistical mean, identifying moments when buyer or seller exhaustion reaches critical levels.
Three clearly defined thresholds mark overvalued (above 75), neutral (50), and undervalued (below 25) conditions. When the index reaches extreme zones, the probability of a trend reversal increases significantly. Combined with chart-based confirmation, this creates high-probability reversal setups.