Terms, Privacy & Risk Disclosure
Effective: 17 December 2025 · Provider: Tromza Trading FZ-LLC, Ras Al Khaimah, UAE
A — Our Services
Our services are intended for individuals aged 18 and above. The Data Layers provides TradingView indicators that analyze and visualize market data, including:
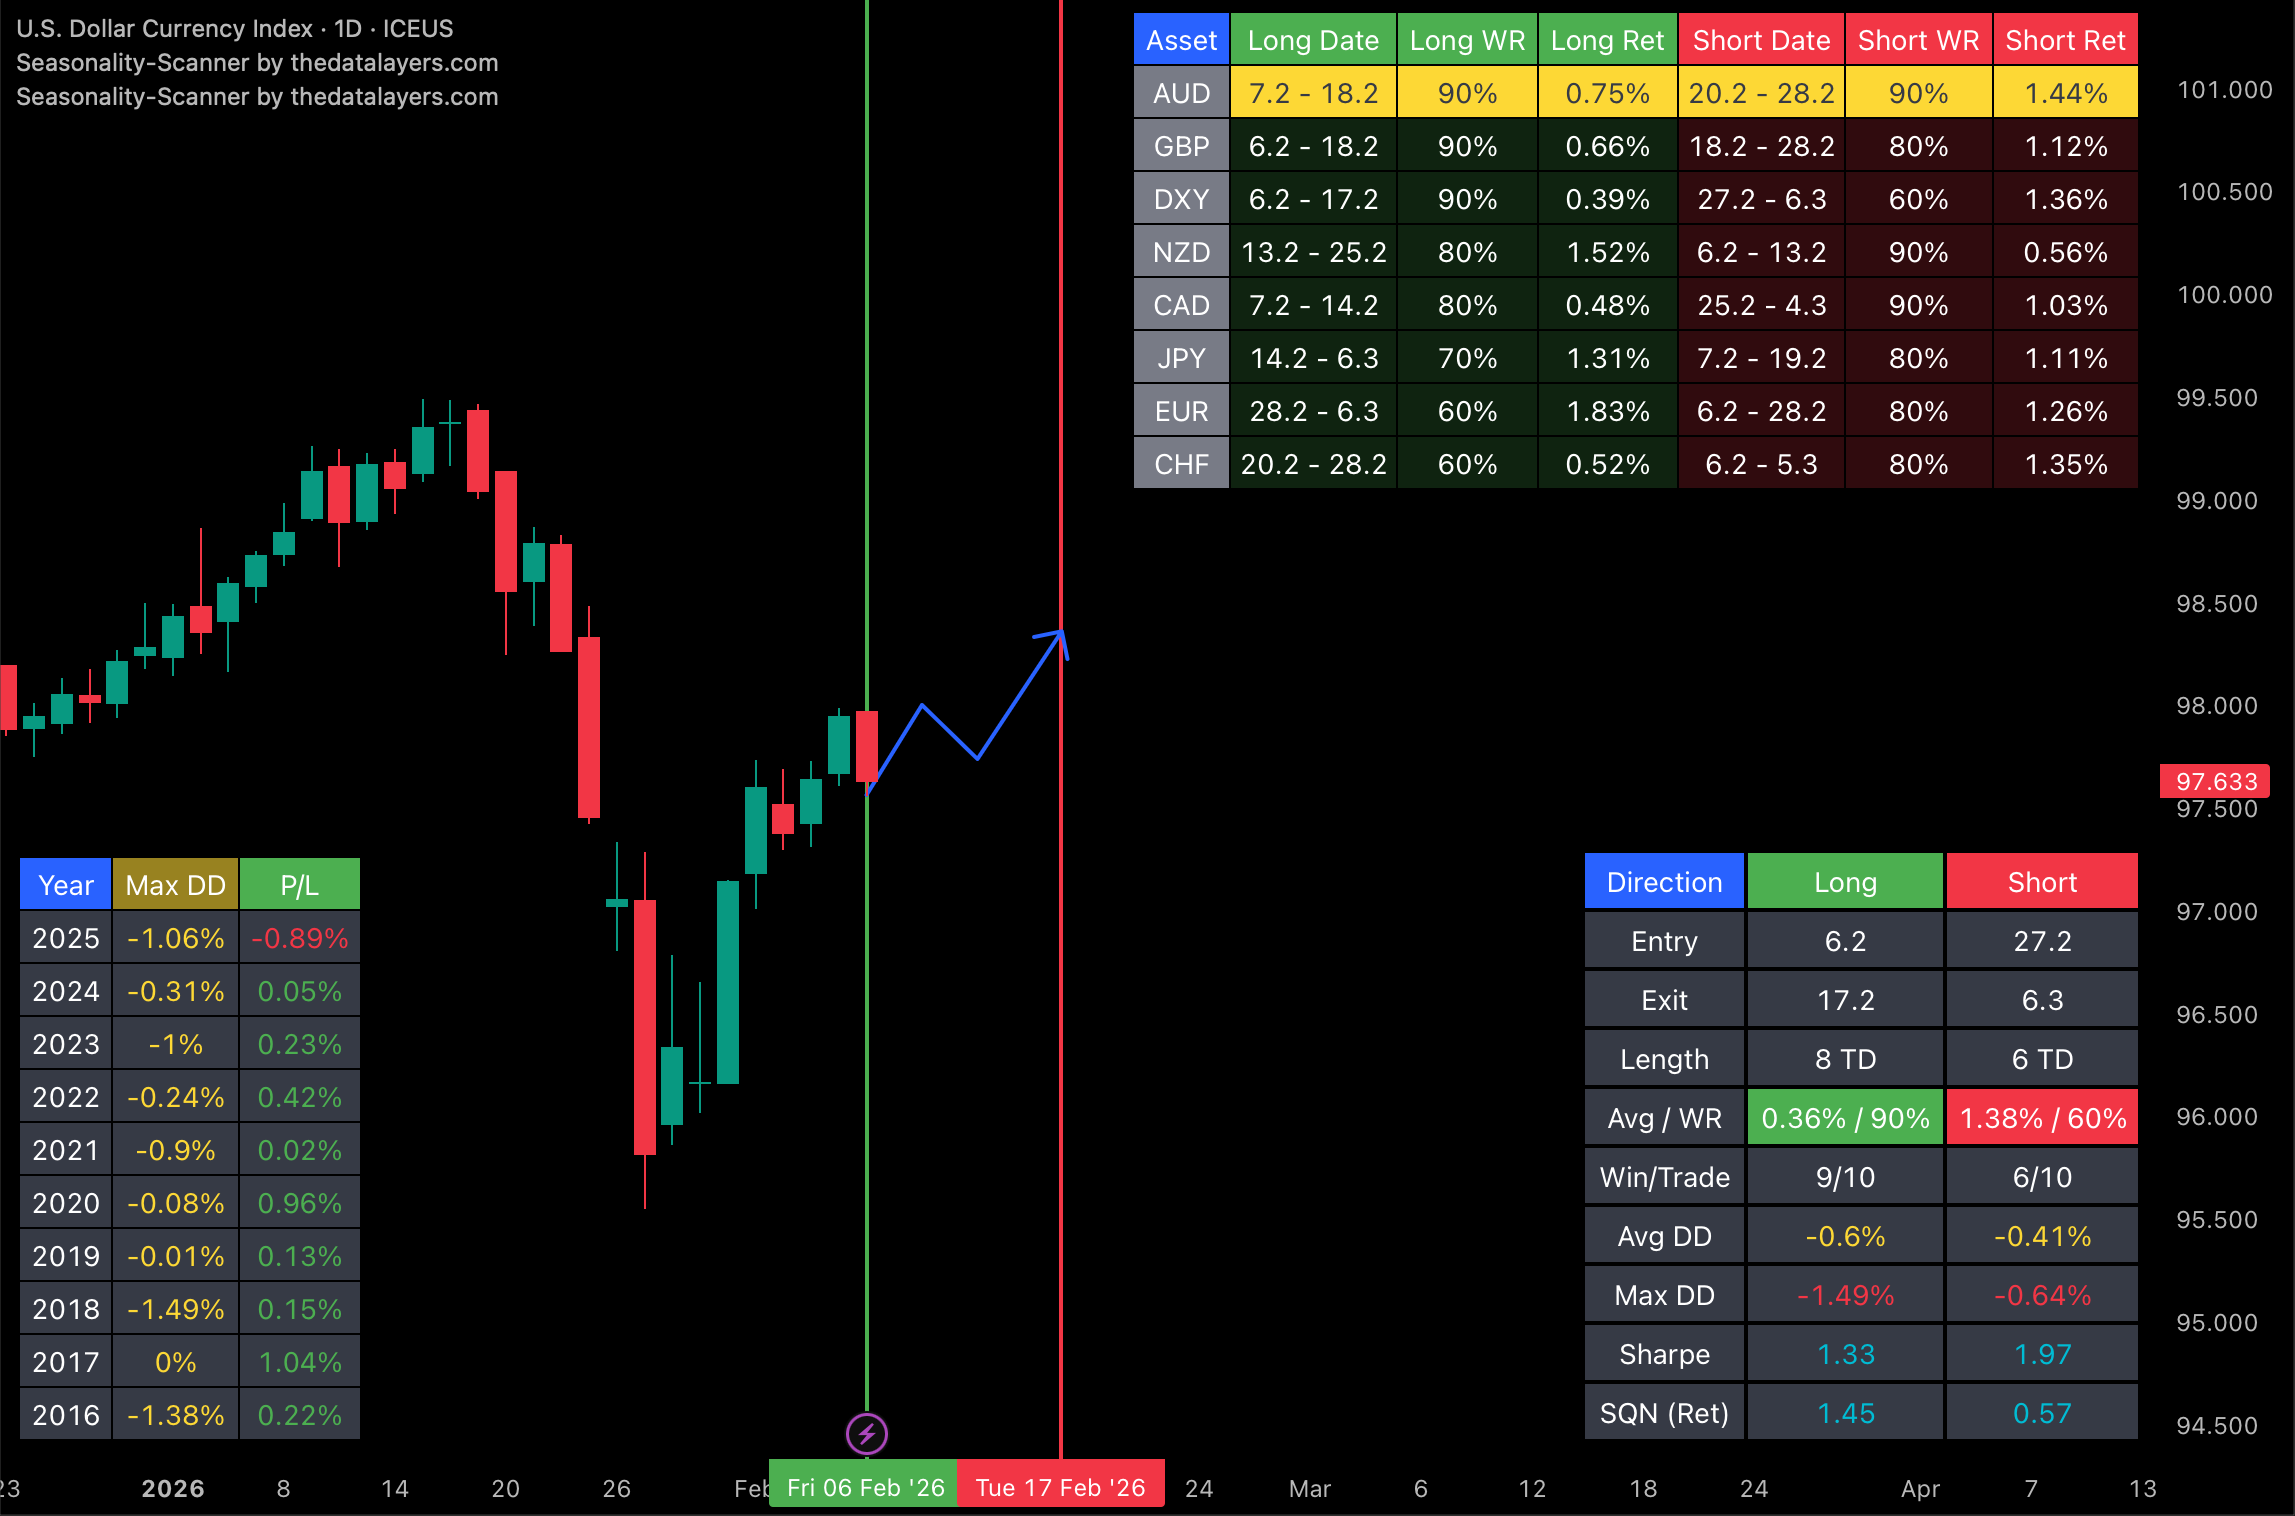
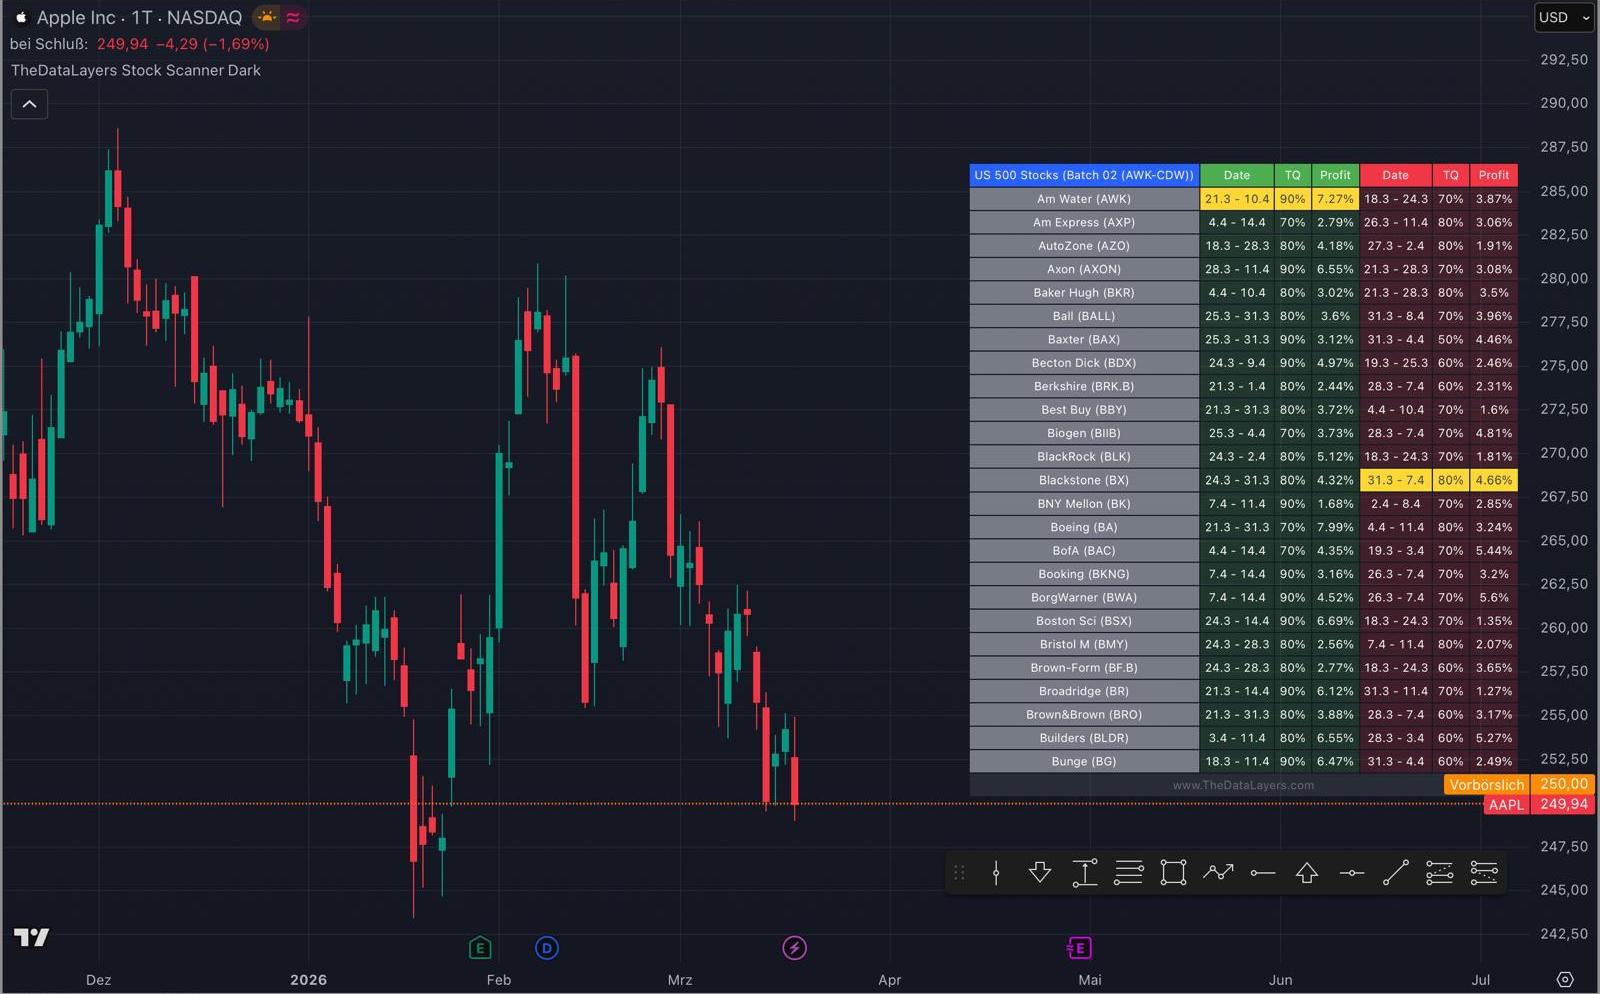
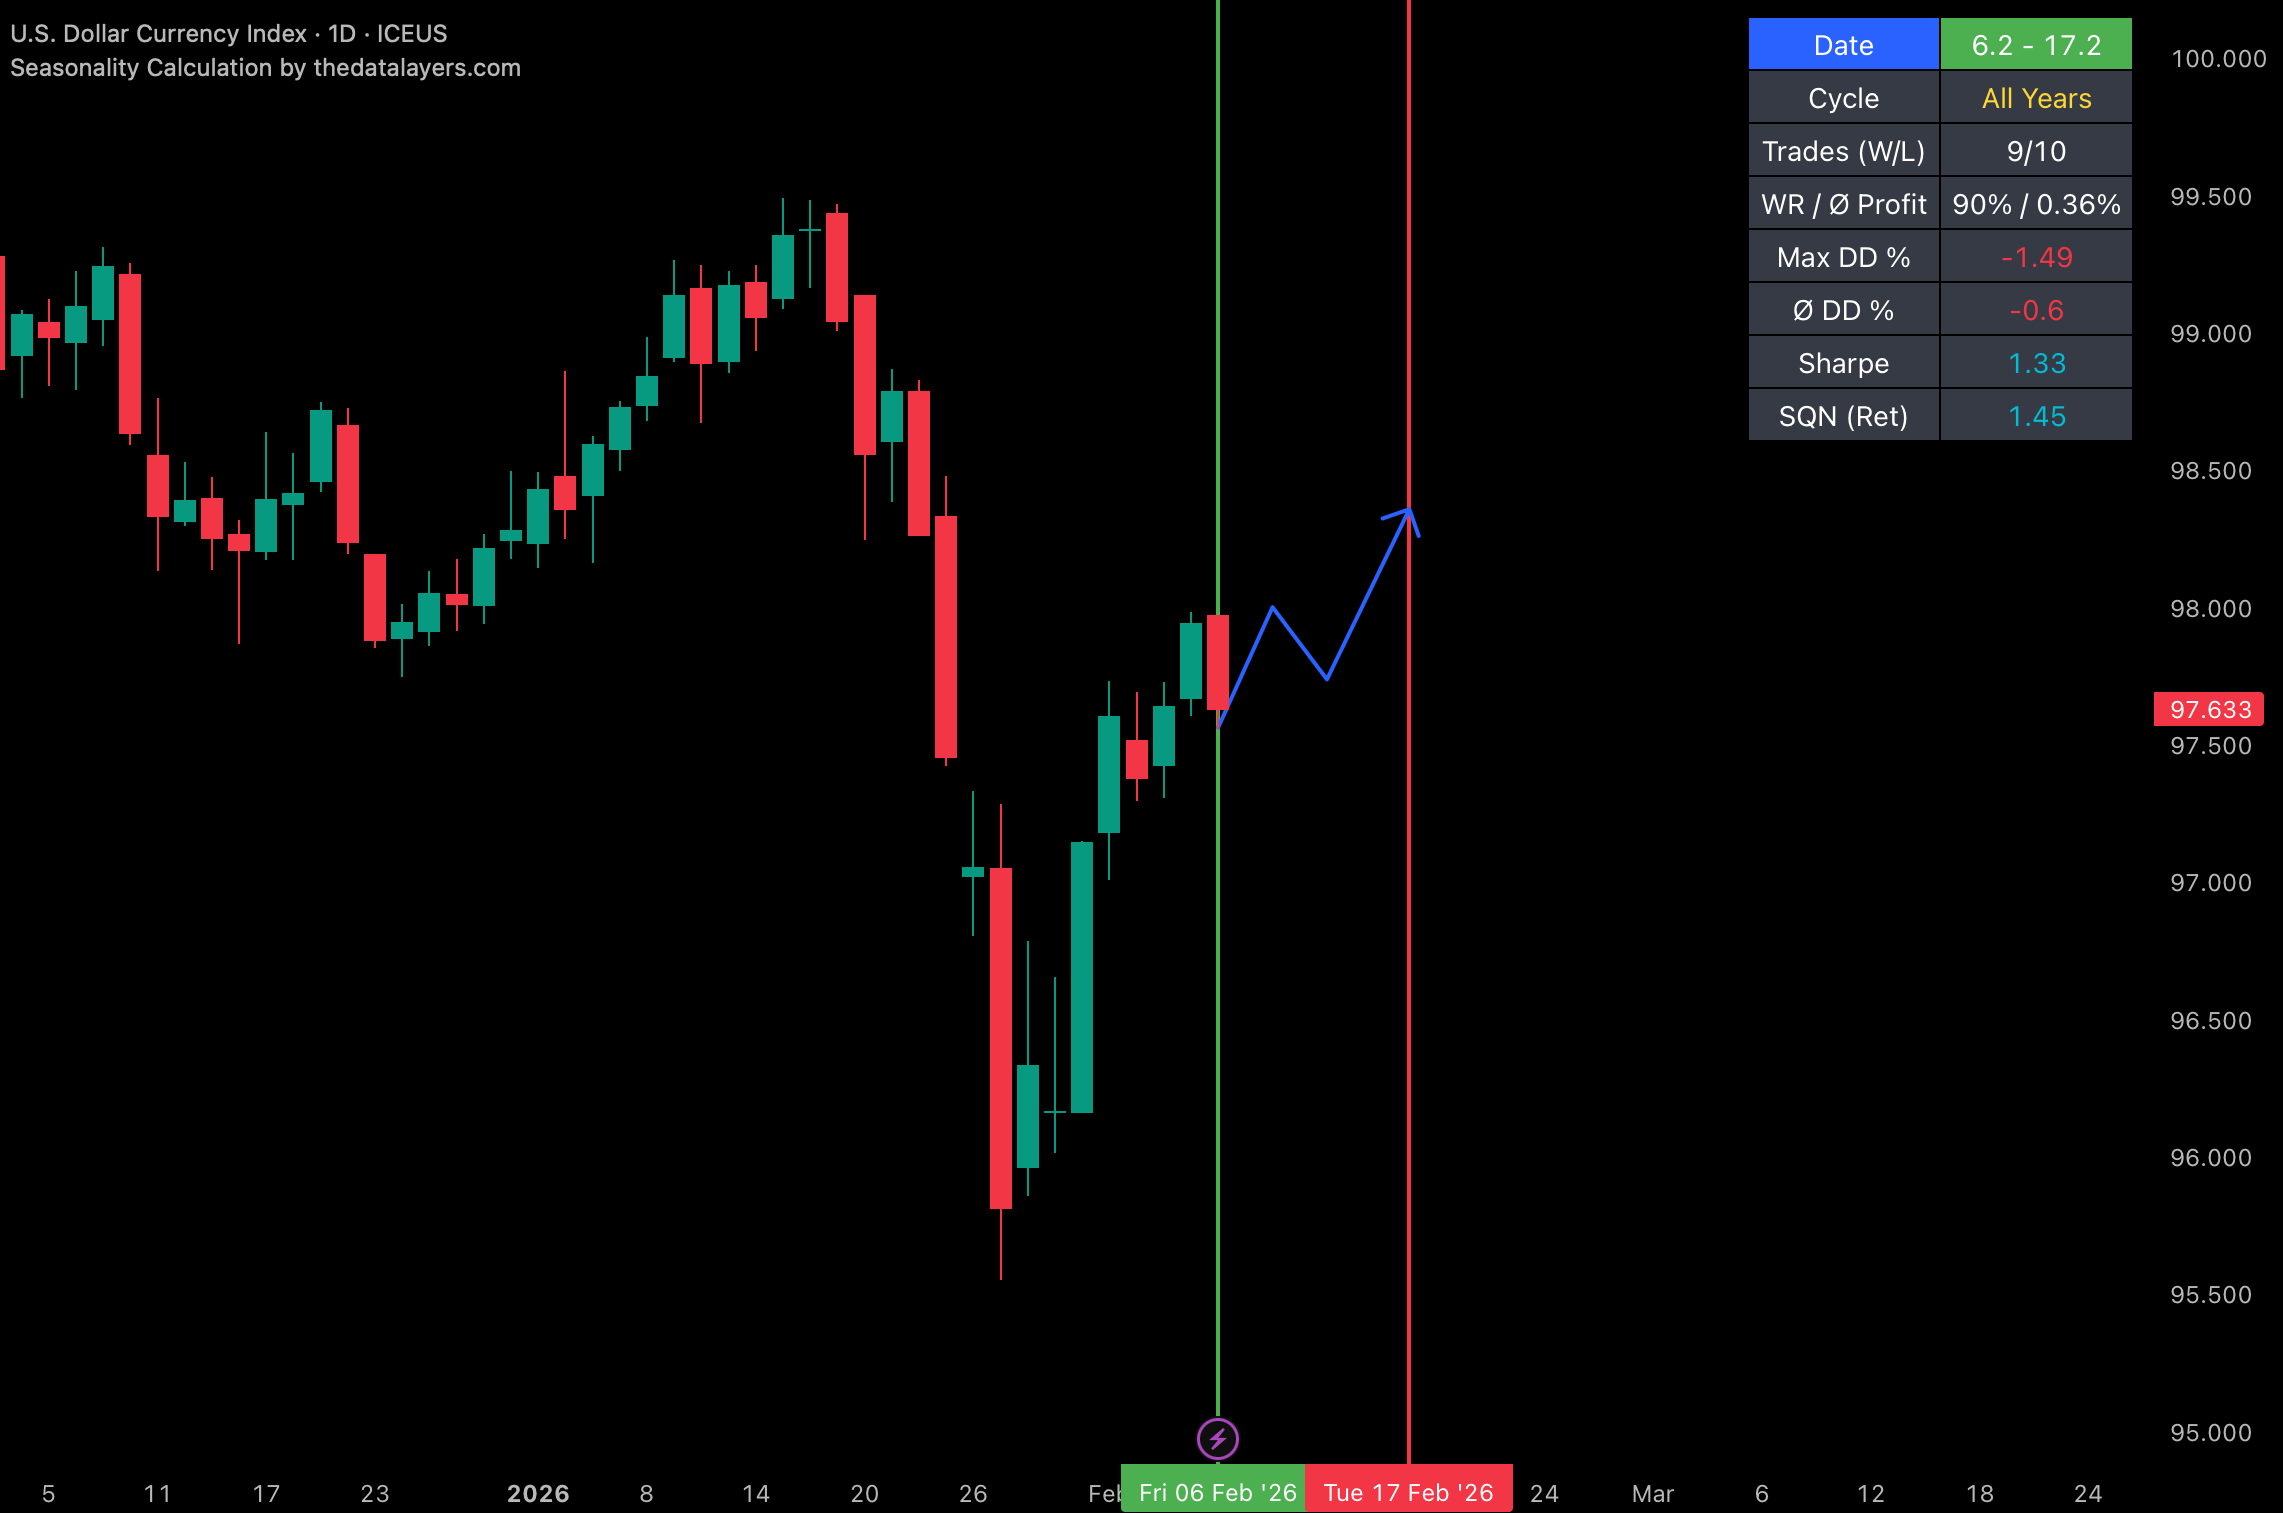
- Seasonality tools (historical seasonal pattern analysis)
- COT data tools (COT Index, COT Net Positions)
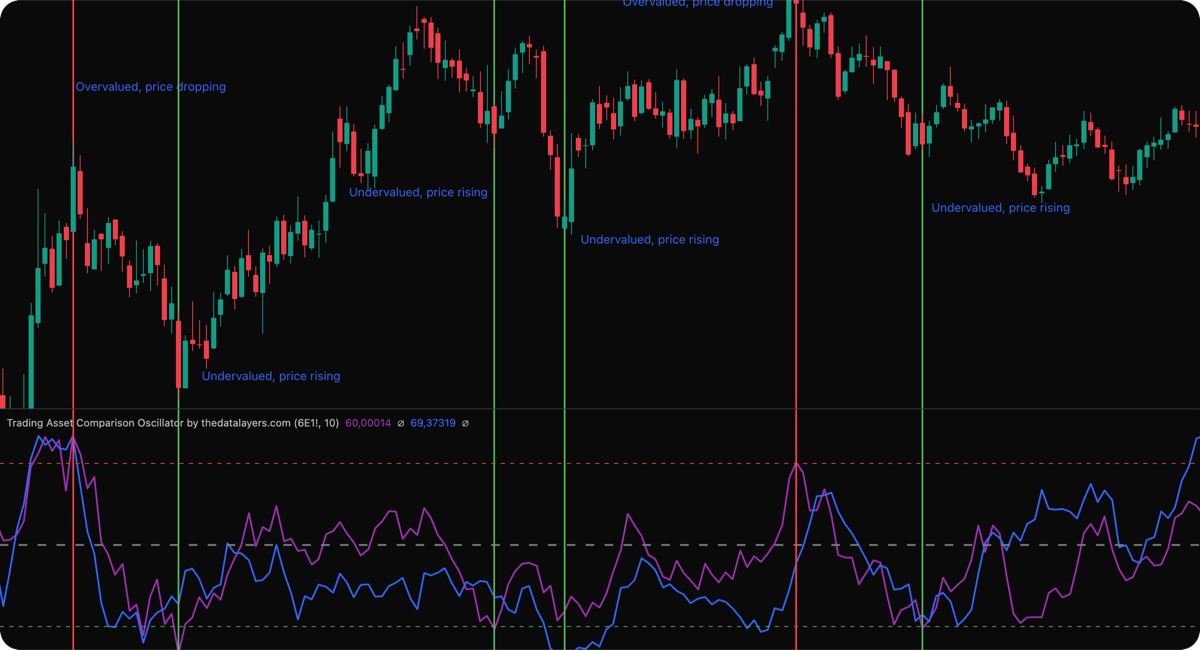
- Intermarket / asset comparison tools
- Trade assistant & position calculators
All tools are based on historical and/or TradingView-provided data and serve analysis and visualization purposes only.
Additionally, The Data Layers operates a marketplace where users can request custom indicators, and where third-party developers may offer their own indicators in the future. Marketplace features are being rolled out gradually.
B — Risk Warning
Trading financial instruments (futures, forex, CFDs, options, crypto, etc.) carries significant risk, including the potential for total loss of capital. Leveraged products can amplify losses rapidly.
Our indicators analyze historical data — past patterns do not guarantee future results. Markets are unpredictable. Your results depend entirely on your own decisions, discipline, and execution.
Never trade money you cannot afford to lose. If unsure, consult a licensed financial advisor.
C — No Advice Disclaimer
The Data Layers does not provide:
- Investment, financial, legal, or tax advice
- Buy or sell recommendations
- Trading signals of any kind
- Automated order execution
Everything we offer is analytical tooling. How you use it is entirely your decision. All trading decisions are made at your own risk and responsibility.
D — Your Responsibility
By purchasing any of our products, you acknowledge that all trading and investment decisions are yours alone. You accept full responsibility for outcomes. There is no guarantee that using our indicators will lead to profits. Success depends on your own discipline, risk management, and execution — not on our tools.
E — Purchasing & Platforms
Whop (Payment Platform)
All purchases are processed through Whop, an independent platform for digital products. They handle payment collection, invoicing, recurring billing, and subscription management. Prices, subscription periods, and plan details are displayed in the Whop checkout. Subscriptions renew automatically until cancelled through your Whop account.
TradingView (Indicator Platform)
Our indicators run inside TradingView — you need a TradingView account to use them (may require a paid TradingView plan). After purchase, provide your TradingView username so we can grant access. Ensure the username is correct; typos cause delays. There is no business affiliation with TradingView; third-party names are used solely to describe the technical environment.
Marketplace & Custom Requests
The Data Layers marketplace allows users to request custom TradingView indicators. Acceptance of requests is at our sole discretion. Pricing and delivery for custom work are agreed individually. Once a custom indicator is delivered and access granted, the same terms regarding refunds and usage apply as for standard indicators.
In the future, third-party developers may offer indicators through our marketplace. The Data Layers acts as an intermediary and does not guarantee the quality, accuracy, or functionality of third-party indicators. Each third-party indicator is provided under the responsibility of its developer.
Refunds
Digital products are generally non-refundable once access is granted, to the extent permitted by law. Mandatory statutory rights (including consumer rights) remain unaffected.
EU/EEA Right of Withdrawal
If you are a consumer in the EU/EEA, you may have a 14-day withdrawal right. To exercise withdrawal, send a clear declaration to: support@thedatalayers.com. If you request that services begin during the withdrawal period and later withdraw, you may owe compensation for services already provided.
F — Usage Rules & Liability
Usage Rules
Your subscription grants a simple, non-transferable, non-sublicensable right to use the indicators for your own analytical purposes during an active subscription. You may not:
- Share access with third parties
- Resell, sublicense, or rent access
- Reverse-engineer or extract code/logic
- Circumvent technical protections or plan limits
Liability
The provider is fully liable for intent, gross negligence, and injury to life, body, or health. For slight negligence, liability is limited to foreseeable, typical damages from breach of material contractual obligations. To the extent permitted by law, the provider is not liable for trading losses, missed opportunities, data errors, or interruptions caused by third-party platforms.
Maximum liability is limited to fees paid in the prior 6 months, except where limitations are legally prohibited.
Service Availability
Services are provided "as available." Uninterrupted operation is not guaranteed. Maintenance, updates, platform issues (TradingView, Whop), or internet problems may cause temporary interruptions. We may update, modify, or discontinue features for technical, security, or compliance reasons.
G — Privacy & Data Protection
Data Controller
Tromza Trading FZ-LLC
FDCW2244, Compass Building, Al Shohada Road
AL Hamra Industrial Zone-FZ, Ras Al Khaimah, UAE
Email: support@thedatalayers.com
If you are located in the EU/EEA, mandatory data protection regulations (including GDPR) may apply depending on the scope of the offering.
What Data We Collect
- Website access: Server log data (IP, timestamp, page, user agent) for security and operations
- Support: Contact details and message content when you reach out
- Purchases via Whop: Account/order data (name, email, subscription status, plan, timestamps)
- Activation: Your TradingView username to grant indicator access
- Marketplace requests: Details you provide when requesting custom indicators
Payments are processed by Whop and its payment partners. We generally do not receive full payment card details.
Why We Process Your Data
- Contract performance (Art. 6(1)(b) GDPR): subscription delivery, activation, support, marketplace requests
- Legitimate interests (Art. 6(1)(f) GDPR): website operations, security, fraud prevention
- Legal obligations (Art. 6(1)(c) GDPR): accounting, regulatory compliance
- Consent (Art. 6(1)(a) GDPR): only for non-essential cookies/analytics, if used
Who Receives Your Data
Whop (checkout, billing, subscription management), TradingView (indicator access activation), hosting/IT providers, and authorities where legally required. Whop and TradingView may act as independent data controllers for certain processing. We do not sell your data.
International Transfers
The provider is based in the UAE. If you are in the EU/EEA, this may constitute a third-country transfer. Where GDPR applies, appropriate safeguards (e.g., Standard Contractual Clauses) and additional measures may be employed.
Retention
Personal data is retained only as long as necessary for the stated purposes, including the duration of your subscription and applicable legal retention periods.
Your Rights
Where GDPR applies, you may request: access, correction, deletion, restriction of processing, data portability, or object to processing based on legitimate interests. You may also withdraw consent at any time and lodge a complaint with a supervisory authority. Contact: support@thedatalayers.com
Cookies & Analytics
This website uses Google Analytics (Google Ireland Ltd / Google LLC, USA) to analyze website traffic. Google Analytics sets cookies (e.g. _ga, _ga_*) with a storage duration of up to 2 years. Data collected includes pages visited, session duration, and approximate location. This data may be transferred to Google servers in the USA.
Google Analytics is only activated after you give explicit consent via our cookie banner (Art. 6(1)(a) GDPR). You can withdraw your consent at any time by clearing your browser cookies. No essential cookies are used beyond what is technically necessary for website operation.
H — Applicable Law
These terms are governed by the laws of the United Arab Emirates, applicable in the Emirate of Ras Al Khaimah, excluding conflict of laws rules. For consumers in the EU/EEA, mandatory consumer protection provisions of their country of residence remain unaffected. Jurisdiction is Ras Al Khaimah, UAE, unless mandatory consumer jurisdictions provide otherwise.
Nothing in these terms affects mandatory consumer protection rights under your local law.
AGB, Datenschutz & Risikohinweis
Gültig ab: 17. Dezember 2025 · Anbieter: Tromza Trading FZ-LLC, Ras Al Khaimah, VAE
A — Unsere Leistungen
The Data Layers stellt TradingView-Indikatoren bereit, die Marktdaten analysieren und visualisieren:
- Saisonalitäts-Tools (historische Musteranalyse)
- COT-Daten-Tools (COT Index, COT Net Positions)
- Intermarket- / Asset-Vergleichstools
- Trade-Assistent & Positionsrechner
Alle Tools basieren auf historischen und/oder über TradingView bereitgestellten Daten und dienen ausschließlich Analyse- und Visualisierungszwecken.
Darüber hinaus betreibt The Data Layers einen Marktplatz, über den Nutzer individuelle Indikatoren anfragen können und auf dem künftig auch Drittanbieter eigene Indikatoren anbieten können. Die Marktplatz-Funktionen werden schrittweise eingeführt.
B — Risikohinweis
Der Handel mit Finanzinstrumenten (Futures, Forex, CFDs, Optionen, Krypto etc.) ist hochriskant und kann zu schnellen Verlusten bis hin zum Totalverlust führen. Hebelprodukte können Verluste rapide verstärken.
Unsere Indikatoren analysieren historische Daten — vergangene Muster garantieren keine zukünftigen Ergebnisse. Märkte sind unvorhersehbar. Ihre Ergebnisse hängen ausschließlich von Ihren eigenen Entscheidungen, Disziplin und Umsetzung ab.
Handeln Sie niemals mit Geld, dessen Verlust Sie sich nicht leisten können. Konsultieren Sie im Zweifelsfall einen zugelassenen Finanzberater.
C — Keine Anlageberatung
The Data Layers erbringt keine:
- Anlage-, Finanz-, Rechts- oder Steuerberatung
- Kauf- oder Verkaufsempfehlungen
- Handelssignale jeglicher Art
- Automatisierte Orderausführung
Alles, was wir anbieten, sind Analysetools. Wie Sie diese nutzen, liegt ausschließlich in Ihrer Verantwortung. Alle Handelsentscheidungen treffen Sie eigenverantwortlich und auf eigenes Risiko.
D — Eigenverantwortung
Mit dem Erwerb unserer Produkte bestätigen Sie, dass alle Handels- und Anlageentscheidungen allein bei Ihnen liegen. Sie übernehmen die volle Verantwortung für die Ergebnisse. Es gibt keine Garantie, dass die Nutzung unserer Indikatoren zu Gewinnen führt. Erfolg hängt von Ihrer eigenen Disziplin, Ihrem Risikomanagement und Ihrer Umsetzung ab — nicht von unseren Tools.
E — Kauf & Plattformen
Whop (Zahlungsplattform)
Alle Käufe werden über Whop abgewickelt, eine unabhängige Plattform für digitale Produkte. Whop übernimmt Zahlungseinzug, Rechnungsstellung, wiederkehrende Abrechnung und Abo-Verwaltung. Preise, Laufzeiten und Plandetails werden im Whop-Checkout angezeigt. Abonnements verlängern sich automatisch bis zur Kündigung über das Whop-Konto.
TradingView (Indikator-Plattform)
Unsere Indikatoren laufen innerhalb von TradingView — Sie benötigen ein TradingView-Konto (ggf. kostenpflichtig). Nach dem Kauf geben Sie Ihren TradingView-Benutzernamen an, damit wir den Zugang freischalten können. Stellen Sie sicher, dass der Name korrekt ist; Tippfehler führen zu Verzögerungen. Es besteht keine geschäftliche Verbindung zu TradingView.
Marktplatz & individuelle Anfragen
Der Marktplatz von The Data Layers ermöglicht es Nutzern, individuelle TradingView-Indikatoren anzufragen. Die Annahme von Anfragen liegt in unserem alleinigen Ermessen. Preise und Lieferung für individuelle Entwicklungen werden einzeln vereinbart. Sobald ein individueller Indikator geliefert und der Zugang gewährt wurde, gelten dieselben Bedingungen zu Erstattungen und Nutzung wie für Standard-Indikatoren.
Künftig können Drittanbieter-Entwickler Indikatoren über unseren Marktplatz anbieten. The Data Layers fungiert dabei als Vermittler und übernimmt keine Gewähr für Qualität, Genauigkeit oder Funktionalität von Drittanbieter-Indikatoren. Jeder Drittanbieter-Indikator wird unter der Verantwortung seines Entwicklers bereitgestellt.
Erstattungen
Digitale Produkte sind nach Freischaltung grundsätzlich nicht erstattungsfähig, soweit gesetzlich zulässig. Zwingende gesetzliche Rechte (insbesondere Verbraucherrechte) bleiben unberührt.
Widerrufsrecht (EU/EWR-Verbraucher)
Als Verbraucher in der EU/dem EWR steht Ihnen ggf. ein 14-tägiges Widerrufsrecht zu. Zur Ausübung senden Sie eine eindeutige Erklärung an: support@thedatalayers.com. Wenn Sie den Leistungsbeginn während der Widerrufsfrist verlangen und anschließend widerrufen, kann Wertersatz für bereits erbrachte Leistungen geschuldet werden.
F — Nutzungsregeln & Haftung
Nutzungsregeln
Ihr Abonnement gewährt ein einfaches, nicht übertragbares, nicht unterlizenzierbares Nutzungsrecht für die Indikatoren zu eigenen Analysezwecken während eines aktiven Abos. Es ist untersagt:
- Zugänge an Dritte weiterzugeben
- Zugänge weiterzuverkaufen, unterzulizenzieren oder zu vermieten
- Reverse Engineering oder Code-/Logik-Extraktion durchzuführen
- Technische Schutzmaßnahmen oder Plan-Limits zu umgehen
Haftung
Der Anbieter haftet unbeschränkt bei Vorsatz, grober Fahrlässigkeit sowie bei Verletzung von Leben, Körper oder Gesundheit. Bei leichter Fahrlässigkeit ist die Haftung auf den vorhersehbaren, typischen Schaden bei Verletzung wesentlicher Vertragspflichten beschränkt. Soweit gesetzlich zulässig, haftet der Anbieter nicht für Handelsverluste, entgangene Gewinne, Datenfehler oder Unterbrechungen durch Drittplattformen.
Die maximale Haftung ist auf die in den letzten 6 Monaten gezahlten Entgelte beschränkt, soweit gesetzlich zulässig.
Verfügbarkeit
Leistungen werden „wie verfügbar" bereitgestellt. Ein unterbrechungsfreier Betrieb wird nicht zugesichert. Wartung, Updates, Plattformprobleme (TradingView, Whop) oder Internetstörungen können zu vorübergehenden Unterbrechungen führen.
G — Datenschutz
Verantwortlicher
Tromza Trading FZ-LLC
FDCW2244, Compass Building, Al Shohada Road
AL Hamra Industrial Zone-FZ, Ras Al Khaimah, VAE
E-Mail: support@thedatalayers.com
Sofern Sie sich in der EU/dem EWR befinden, können zwingende Datenschutzvorschriften (einschließlich DSGVO) anwendbar sein.
Welche Daten wir verarbeiten
- Website-Zugriff: Server-Logdaten (IP, Zeitstempel, Seite, User-Agent) für Sicherheit und Betrieb
- Support: Kontaktdaten und Nachrichteninhalte bei Anfragen
- Kauf über Whop: Account-/Bestelldaten (Name, E-Mail, Abo-Status, Plan, Zeitstempel)
- Freischaltung: Ihr TradingView-Benutzername zur Indikator-Freischaltung
- Marktplatz-Anfragen: Angaben, die Sie bei der Anfrage individueller Indikatoren machen
Zahlungen werden von Whop und dessen Zahlungspartnern verarbeitet. Wir erhalten in der Regel keine vollständigen Zahlungskartendaten.
Zwecke & Rechtsgrundlagen
- Vertragserfüllung (Art. 6 Abs. 1 lit. b DSGVO): Abo-Bereitstellung, Freischaltung, Support, Marktplatz-Anfragen
- Berechtigte Interessen (Art. 6 Abs. 1 lit. f DSGVO): Betrieb, Sicherheit, Betrugsprävention
- Rechtliche Pflichten (Art. 6 Abs. 1 lit. c DSGVO): Buchhaltung, Compliance
- Einwilligung (Art. 6 Abs. 1 lit. a DSGVO): nur für nicht notwendige Cookies/Analytics
Empfänger
Whop (Checkout, Abrechnung, Abo-Verwaltung), TradingView (Indikator-Freischaltung), Hosting-/IT-Dienstleister sowie Behörden, soweit gesetzlich erforderlich. Whop und TradingView können für bestimmte Verarbeitungen eigenständige Verantwortliche sein. Wir verkaufen Ihre Daten nicht.
Drittlandtransfer
Der Anbieter hat seinen Sitz in den VAE. Für Nutzer in der EU/dem EWR kann dies eine Drittlandübermittlung darstellen. Geeignete Garantien (z. B. EU-Standardvertragsklauseln) und zusätzliche Maßnahmen können eingesetzt werden.
Speicherdauer
Personenbezogene Daten werden nur so lange gespeichert, wie es für die genannten Zwecke erforderlich ist, einschließlich Abo-Laufzeit und gesetzlicher Aufbewahrungsfristen.
Betroffenenrechte
Soweit die DSGVO gilt: Auskunft, Berichtigung, Löschung, Einschränkung, Datenübertragbarkeit, Widerspruch gegen Verarbeitung auf Basis berechtigter Interessen, Widerruf einer Einwilligung, Beschwerde bei einer Aufsichtsbehörde. Kontakt: support@thedatalayers.com
Cookies & Analyse
Diese Website verwendet Google Analytics (Google Ireland Ltd / Google LLC, USA) zur Analyse des Webseiten-Traffics. Google Analytics setzt Cookies (z.B. _ga, _ga_*) mit einer Speicherdauer von bis zu 2 Jahren. Erfasst werden u.a. besuchte Seiten, Sitzungsdauer und ungefährer Standort. Daten können an Google-Server in den USA übermittelt werden.
Google Analytics wird erst nach ausdrücklicher Einwilligung über unseren Cookie-Banner aktiviert (Art. 6 Abs. 1 lit. a DSGVO). Sie können Ihre Einwilligung jederzeit über den Link „Cookie-Einstellungen" im Footer widerrufen. Darüber hinaus werden keine Cookies eingesetzt, die über das technisch Notwendige hinausgehen.
H — Anwendbares Recht
Diese Bedingungen unterliegen dem Recht der Vereinigten Arabischen Emirate, anwendbar im Emirat Ras Al Khaimah, unter Ausschluss des Kollisionsrechts. Für Verbraucher in der EU/dem EWR bleibt der Schutz zwingender Verbraucherschutzvorschriften des Wohnsitzstaates unberührt. Gerichtsstand ist Ras Al Khaimah, VAE, sofern zwingende Verbrauchergerichtsstände nichts anderes vorsehen.
Zwingende Verbraucherrechte nach dem Recht Ihres Wohnsitzlandes bleiben von diesen Bedingungen unberührt.