T-Metrics Market Momentum
by T-Metrics
Understand what happens beneath the price surface. This analysis tool combines automatic market structure levels and multi-cycle momentum in one indicator. Identify mathematically when a move is losing strength.
Features
- Adjustable Market Structure Oscillator (+ Crosses)
- Adjustable Cycle Oscillator Histogram (+ Crosses)
- Market Structure (Short, Intermediate, Long Term)
- Multi-Cycle Oscillator
Description
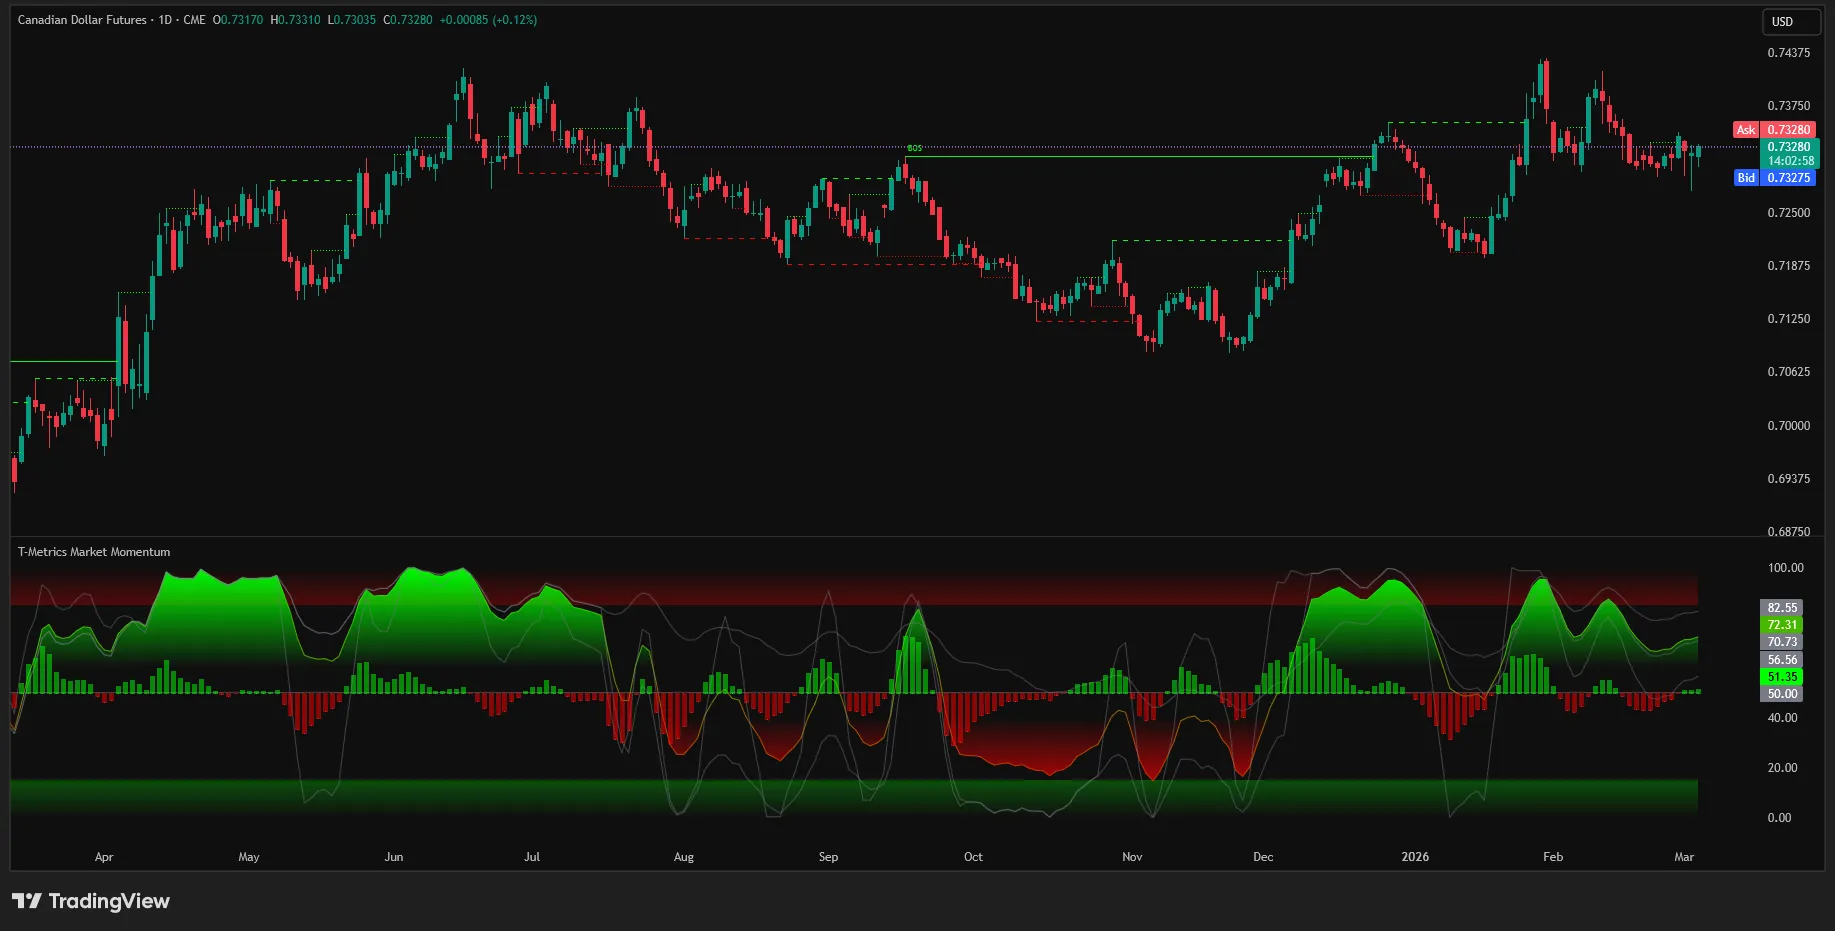
T-Metrics Market Momentum projects automatic market structure levels directly onto your chart — dynamic support and resistance zones calculated from swing patterns across three timeframes. The oscillator panel below visualizes the combined directional pressure from short-term, intermediate, and long-term market structure.
The Cycle Oscillator Histogram shows immediate momentum shifts through color changes and cross signals. When the histogram diverges from the main oscillator, it signals potential trend reversals before they become visible on the price chart. Works on all markets and timeframes.